Data Lab 🥽

Hi, I'm Saeed
👨🎓 M.Sc in STEM from Uni Bremen
¯\_(ツ)_/¯ Data Enthusiast
🕵️♂️ Problem-solver
💻 Coding Fan
BRFSS 2013 Dataset Exploration with R
Project description and link:
- Behavioral Risk Factor Surveillance System (BRFSS) a telephone survey that state health departments conduct monthly over landline telephones and cellular telephones with a standardized questionnaire.
- The dataset is accessible in CDC website.
- The data gathering in this survey is a type of random sampling method, so the conclusion could be generalized to the sampled population.(Survey Documentation)
- I explored data for questions about Sleep time, Health Care Access and Demographics.
- Full project document is accessible here.
Summary of analysis and findings:
For each of the questions I was interested to explore, I checked the distribution of the values in the relevant columns and decided if I need to drop the missing data and then tabulated and visualized the data to find if hypothsized realtion actually exist.
1. Health Care coverage and Health care access raletion to Gender and Income level:
I was interested to see if Health care realted data of the survey respondents correlates with demographic data. On the first attempt I looked at Gender and Income to see if there is connection. As we go toward groups with higher income, the proportion of respondents with a health care plan increses, as shown in the chart.
ggplot(subset(health_clean, !is.na(income2)), aes(x = income2, fill = hlthpln1)) +
  geom_bar(position = "fill", aes(y = (..count..)/sum(..count..))) +
  xlab("Income") +
  labs(fill = "Health care coverage") +
  scale_y_continuous(labels = scales::percent, name = "Proportion") +
  coord_flip()
2. Routine Checkups and Gender:
I was curious if routine checkups correlate with the gender of the respondents. It seems that females go to routine checkup more regularly than men. More than 76% of the females did a check up within past year while that number is 68% for men.
# Proportion of Males and Females in check up categories
ggplot(health_clean, aes(x = sex, fill = checkup1)) +
  geom_bar(position = "fill", aes(y = (..count..)/sum(..count..))) +
  xlab("Gender") +
  labs(fill = "Since last checkup") +
  scale_y_continuous(labels = scales::percent, name = "Proportion")
3. Internet Use and Education:
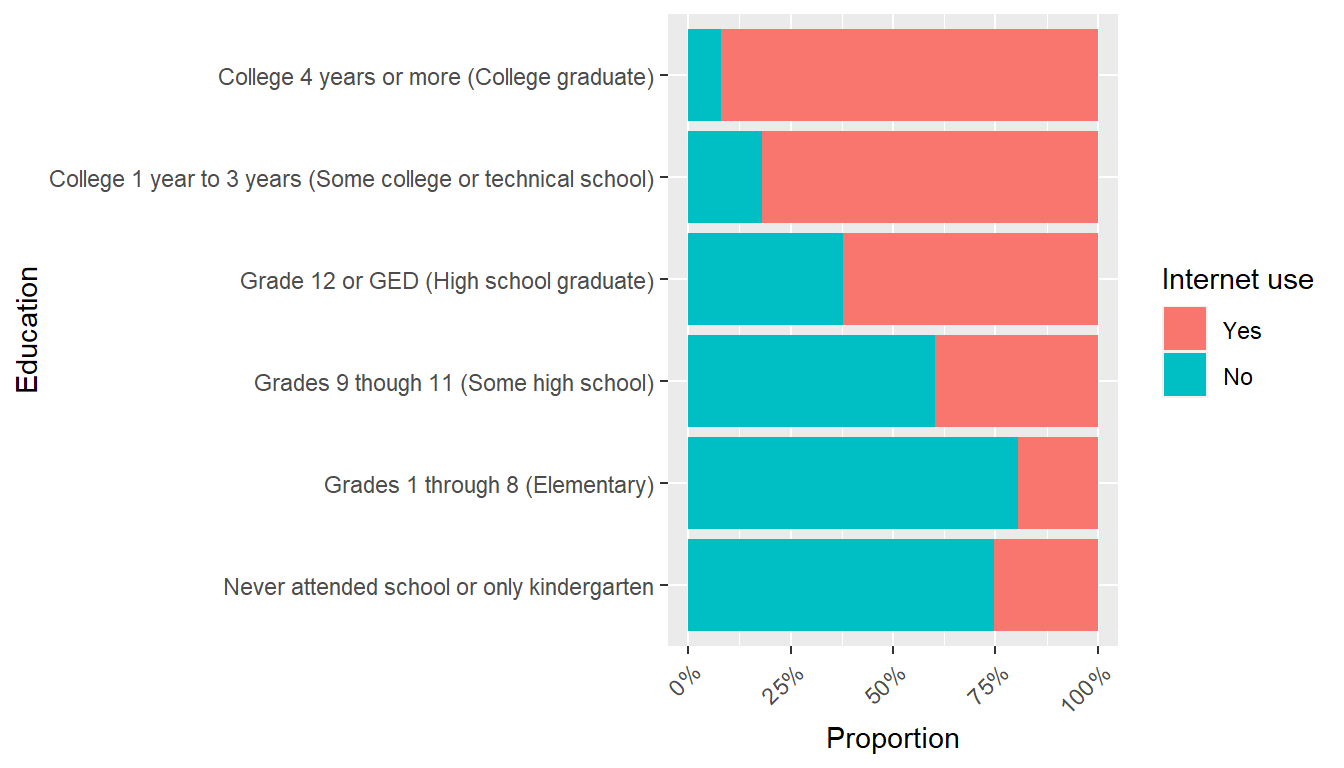
I was wondering if education could be contributing factor to Internet Use of population. The survey asked respondents if they used Internet in the last 30 days. Interestingly enough, there is huge gap in Internet use for people with college degree and higher and people who went to school till 11 grade at most or those who didn’t attended school. About 74% of respondets that never attended school, said No to the survey question while only 7% of college graduates said No.
One might wonder, how big of a implication this will have. Like if certain public services are offered mostly online, then a part of a country’s population will have difficulty reaching it and need other mediums to be able get access.
# Proportion of people that used internet in last 30 days in each education leve
ggplot(demog_clean, aes(x =  educa, fill = internet)) +
  geom_bar(position = "fill", aes(y = (..count..)/sum(..count..))) +
  xlab("Education") +
  labs(fill = "Internet use") +
  scale_y_continuous(labels = scales::percent, name = "Proportion") +
  theme(axis.text.x = element_text(angle = 45, hjust = 1)) +
  coord_flip()
